Best China Manufacturing Efficiency Solutions for Buyers?
Choosing the best China manufacturing efficiency solutions requires more than comparing factory prices. Buyers must examine production speed, quality consistency, communication, and total operating cost. A lower quotation may hide rework, delayed shipments, or weak process control.
Experienced buyers often begin with factory audits, sample reviews, and small pilot orders. They inspect production lines, worker training, equipment maintenance, and quality records. Useful evidence includes defect rates, on-time delivery data, capacity reports, and corrective action logs. Clear specifications also matter. A drawing with tolerances, material grades, packaging details, and inspection standards prevents expensive misunderstandings.
The right partner should explain its methods, not only promise savings. Lean production, digital inventory tracking, automated inspection, and supplier coordination can improve efficiency when applied carefully. Still, technology alone cannot repair unclear communication or unstable management. That is easy to overlook.
Reliable decisions also require independent verification. Buyers can compare third-party inspection results with factory claims and review references from similar industries. Compliance, ethical sourcing, worker safety, and documented contracts should remain part of the evaluation. These safeguards support sustainable purchasing and reduce avoidable risks.
This guide explores practical manufacturing efficiency solutions for international buyers seeking dependable Chinese suppliers. It considers cost, quality, lead time, flexibility, and long-term cooperation. No factory performs perfectly. Even strong systems need monitoring, honest feedback, and periodic improvement. The goal is not the fastest factory. It is the most dependable production system for a buyer’s specific needs.
China’s Manufacturing Scale: 31.6% of Global Value Added in 2023
Best China Manufacturing Efficiency Solutions for Buyers?
China’s manufacturing sector generated 31.6% of global manufacturing value added in 2023. This figure shows exceptional industrial depth, not simply low production costs. Buyers can access dense supplier networks, specialized tooling, mature logistics, and experienced production teams. Scale matters.
However, national strength does not guarantee factory efficiency. A buyer may still face idle machines, uneven line balancing, or unclear rework records. That assumption is risky. During supplier evaluations, request recent production data, defect rates, changeover times, and on-time delivery results. Factory visits should include a walk through material storage, inspection points, and finished-goods staging areas.
Practical efficiency solutions often begin with small controls. Digital production boards can reveal delays by shift and workstation. Standardized work instructions reduce variation between operators. Barcode tracking helps connect raw materials with inspection results. Buyers should also compare total landed cost, including packaging, transport, quality corrections, and inventory holding. A lower quotation may hide expensive friction.
Experienced procurement teams can test improvements through a limited production run before expanding volume. They should define measurable targets, such as reducing changeover time by 15% or keeping critical defects below an agreed threshold. Not every supplier will welcome this level of visibility. That resistance is useful evidence. Efficiency is measurable, but the measurement system itself may need improvement.
Supplier Qualification: Verify ISO 9001, Defects Below 1,000 PPM, and 95% OTD
Best China Manufacturing Efficiency Solutions for Buyers?
Supplier qualification should begin with evidence, not polished factory photographs. Ask for a current ISO 9001 certificate, then verify its scope, site address, expiry date, and issuing body. The certificate must cover the facility producing your parts. During an on-site or remote audit, review work instructions, calibration records, training logs, and corrective-action reports. These details reveal whether quality controls operate daily.
Defects below 1,000 PPM sounds attractive, but define the calculation. Request inspection data from the previous six to twelve months, including total units, rejected units, defect categories, and customer claims. Review several production lots, not one carefully selected batch. Ask how rework and returns are counted. Numbers can look clean.
On-time delivery should reach at least 95%, measured against confirmed shipment dates. Compare purchase orders, production schedules, packing lists, and freight records. A practical buyer also checks capacity during peak periods, material lead times, and backup processes for equipment failure. I have found that suppliers often report delivery performance differently, so written definitions matter. One audit is not enough. Recheck performance after the first three shipments, and record every deviation. A capable supplier should explain missed targets openly and show a dated corrective plan. Perfect data is rare; unexplained data is worse.
Automation Efficiency: China Reached 470 Robots per 10,000 Workers in 2023
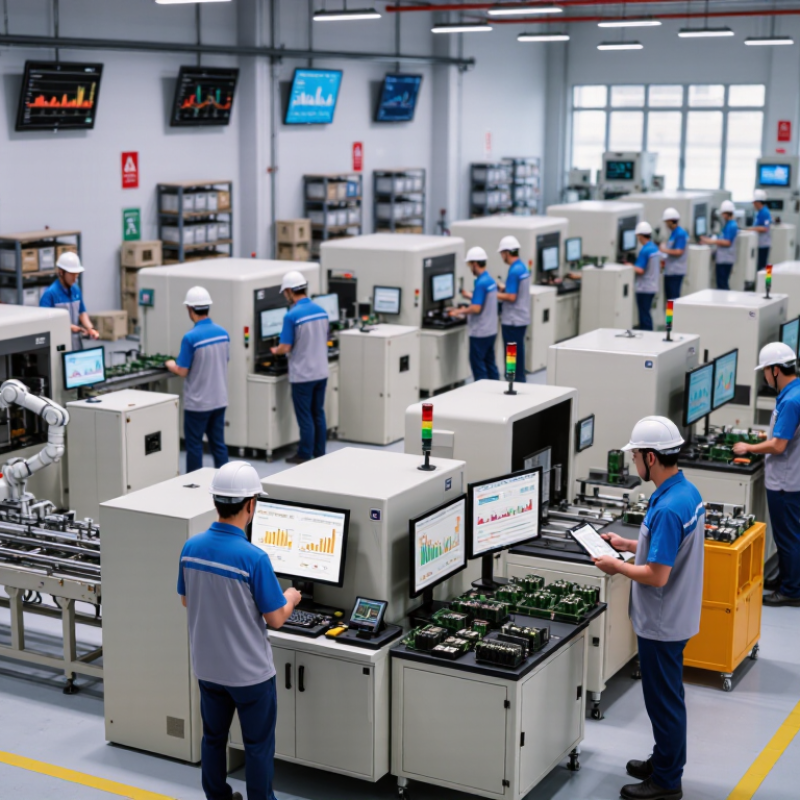
China’s manufacturing efficiency is increasingly shaped by automation. In 2023, China reached 470 industrial robots per 10,000 workers. This figure shows more than factory modernization. It reflects stronger investment in repeatable production, safer handling, and faster quality checks.
For international buyers, robot density can improve consistency on tasks such as welding, assembly, packaging, and machine tending. A robotic arm can repeat the same motion beside a conveyor for hours, while sensors detect missing parts or uneven placement. However, automation does not automatically create efficiency. Poor process design can simply make mistakes happen faster. Buyers should examine cycle time, maintenance access, operator training, and spare-part availability before approving equipment.
The practical question is not how many robots a factory owns. It is how well automation fits the production line. Ask for process data, sample inspection records, and realistic output figures under normal conditions. Visit the facility when possible. Watch a complete shift, not only a prepared demonstration. A reliable supplier should explain downtime, manual interventions, and limits without hiding uncomfortable details. Some factories still depend on workers for final inspection, and that may be sensible for complex products. The best solution may combine automation with skilled human judgment, especially when specifications change frequently. Efficiency is measurable, but it is not always simple.
Best China Manufacturing Efficiency Solutions for Buyers? – Automation Efficiency: China Reached 470 Robots per 10,000 Workers in 2023
| Data Dimension |
Year / Scope |
Reported Value |
Buyer-Oriented Efficiency Meaning |
| Industrial robot density |
China, 2019 |
187 robots / 10,000 workers |
Baseline for measuring the expansion of production automation. |
| Industrial robot density |
China, 2020 |
246 robots / 10,000 workers |
Shows continued automation investment despite pandemic-related disruption. |
| Industrial robot density |
China, 2021 |
322 robots / 10,000 workers |
Indicates rapid adoption of automated handling, assembly, welding and inspection. |
| Industrial robot density |
China, 2022 |
392 robots / 10,000 workers |
Provides a useful benchmark when comparing automation maturity among potential suppliers. |
| Industrial robot density |
China, 2023 |
470 robots / 10,000 workers |
A high national automation-density level supports scalable, repeatable and labor-efficient production. |
| Growth in robot density |
2019–2023 |
+151.3% |
Suggests that buyers should evaluate suppliers’ automation roadmaps, not only their current equipment. |
| Approximate compound annual growth |
2019–2023 |
26.2% per year |
Useful for assessing whether a factory has experience scaling automated production capacity. |
| Priority automation area |
Production operations |
Process-dependent |
Check robotic loading, unloading, assembly, welding, palletizing and material-handling capability. |
| Quality-control automation |
Inspection operations |
Process-dependent |
Assess machine-vision inspection, automated measurement, traceability and defect-data capture. |
| Flexibility for buyer orders |
Mixed-model or small-batch production |
Verify before purchase |
Confirm quick changeover, programmable fixtures, recipe management and multi-product capability. |
| Operational proof required |
Supplier qualification |
Site audit recommended |
Request production-cycle data, first-pass yield, downtime records, maintenance procedures and automation utilization evidence. |
Source: International Federation of Robotics, World Robotics statistics. Robot density refers to the number of operational industrial robots per 10,000 manufacturing workers. Percentage growth is calculated from the reported 2019 and 2023 density figures.